01 Pandas+Pyecharts | Python分析中秋月饼,这几种口味才是yyds
- 可视化系列
- 2025-07-11
- 1759热度
- 1评论
中秋节,又称祭月节、月光诞、月夕、秋节、仲秋节、拜月节、月娘节、月亮节、团圆节等,是中国民间的传统节日。自古便有祭月、赏月、吃月饼、玩花灯、赏桂花、饮桂花酒等民俗,流传至今,经久不息。
本期我们通过分析某宝中秋月饼的销售情况,看看哪些口味月饼卖得好,哪些地方月饼卖得好,希望对小伙伴们有所帮助。
涉及到的库:
- Pandas — 数据处理
- Pyecharts — 数据可视化
- jieba — 分词
- collections — 数据统计
可视化部分:
-
Bar — 柱状图 -
Pie — 饼状图 -
Map— 地图 -
Stylecloud — 词云图
1. 导入模块
import re
import jieba
import stylecloud
import numpy as np
import pandas as pd
from collections import Counter
from pyecharts.charts import *
from pyecharts.components import Image
from pyecharts.charts import WordCloud
from pyecharts import options as opts
from pyecharts.globals import SymbolType
from pyecharts.commons.utils import JsCode
2. Pandas数据处理
2.1 读取数据
df = pd.read_excel("月饼.xlsx")
df.head(10)
2.2 去除重复值
print(df.shape)
df.drop_duplicates(inplace=True)
print(df.shape)
(4520, 5)
(1885, 5)
2.3 空值处理
处理购买人数为空的记录:
df['付款情况'] = df['付款情况'].replace(np.nan,'0人付款')2.4 处理付款情况字段
df[df['付款情况'].str.contains("万")]付款人数超过10000后会直接用"万"替代,这里我们需要将其恢复:
# 提取数值
df['num'] = [re.findall(r'(\d+\.{0,1}\d*)', i)[0] for i in df['付款情况']]
df['num'] = df['num'].astype('float')

# 提取单位(万)
df['unit'] = [''.join(re.findall(r'(万)', i)) for i in df['付款情况']]
df['unit'] = df['unit'].apply(lambda x:10000 if x=='万' else 1)

# 计算销量
df['销量'] = df['num'] * df['unit']
df = df[df['地址'].notna()]
df['省份'] = df['地址'].str.split(' ').apply(lambda x:x[0])

# 删除多余的列
df.drop(['付款情况', 'num', 'unit'], axis=1, inplace=True)

# 重置索引
df = df.reset_index(drop=True)
结果:
3. Pyecharts数据可视化
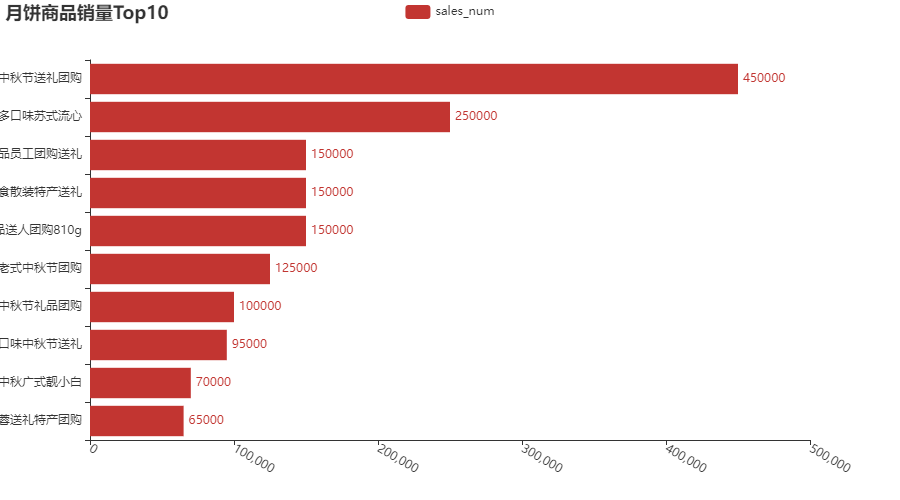
3.1 月饼商品销量Top10
代码:
shop_top10 = df.groupby('商品名称')['销量'].sum().sort_values(ascending=False).head(10)
bar0 = (
    Bar()
        .add_xaxis(shop_top10.index.tolist()[::-1])
        .add_yaxis('sales_num', shop_top10.values.tolist()[::-1])
        .reversal_axis()
        .set_global_opts(title_opts=opts.TitleOpts(title='月饼商品销量Top10'),
                         xaxis_opts=opts.AxisOpts(axislabel_opts=opts.LabelOpts(rotate=-30)))
        .set_series_opts(label_opts=opts.LabelOpts(position='right'))
)
效果:
商品名称太长显示不全,我们调整一下边距:
bar1 = (
    Bar()
        .add_xaxis(shop_top10.index.tolist()[::-1])
        .add_yaxis('sales_num', shop_top10.values.tolist()[::-1],itemstyle_opts=opts.ItemStyleOpts(color=JsCode(color_js)))
        .reversal_axis()
        .set_global_opts(title_opts=opts.TitleOpts(title='月饼商品销量Top10'),
             xaxis_opts=opts.AxisOpts(axislabel_opts=opts.LabelOpts(rotate=-30)),
             )
        .set_series_opts(label_opts=opts.LabelOpts(position='right'))
)
# 将图形整体右移
grid = (
    Grid()
        .add(bar1, grid_opts=opts.GridOpts(pos_left='45%', pos_right='10%'))
)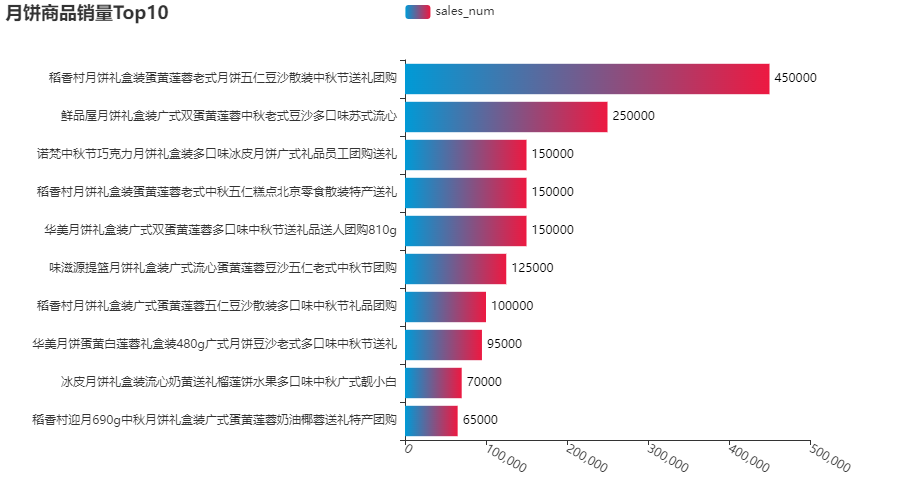
这样是不是好多了。
还可以来些其他(比如:形状)设置:

3.2 月饼销量排名TOP10店铺
代码:
shop_top10 = df.groupby('店铺名称')['销量'].sum().sort_values(ascending=False).head(10)
bar3 = (
    Bar(init_opts=opts.InitOpts(
        width='800px', height='600px',))
    .add_xaxis(shop_top10.index.tolist())
    .add_yaxis('', shop_top10.values.tolist(),
               category_gap='30%',
              )

    .set_global_opts(
        xaxis_opts=opts.AxisOpts(axislabel_opts=opts.LabelOpts(rotate=-30)),
        title_opts=opts.TitleOpts(
            title='月饼销量排名TOP10店铺',
            pos_left='center',
            pos_top='4%',
            title_textstyle_opts=opts.TextStyleOpts(
                color='#ed1941', font_size=16)
        ),
        visualmap_opts=opts.VisualMapOpts(
            is_show=False,
            max_=600000,
            range_color=["#CCD3D9", "#E6B6C2", "#D4587A","#FF69B4", "#DC364C"]
        ),
     )
)
bar3.render_notebook()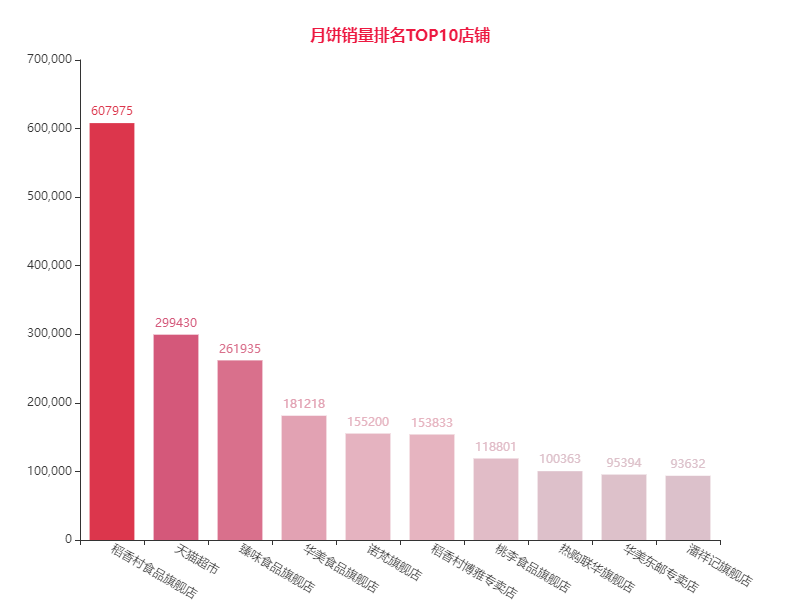
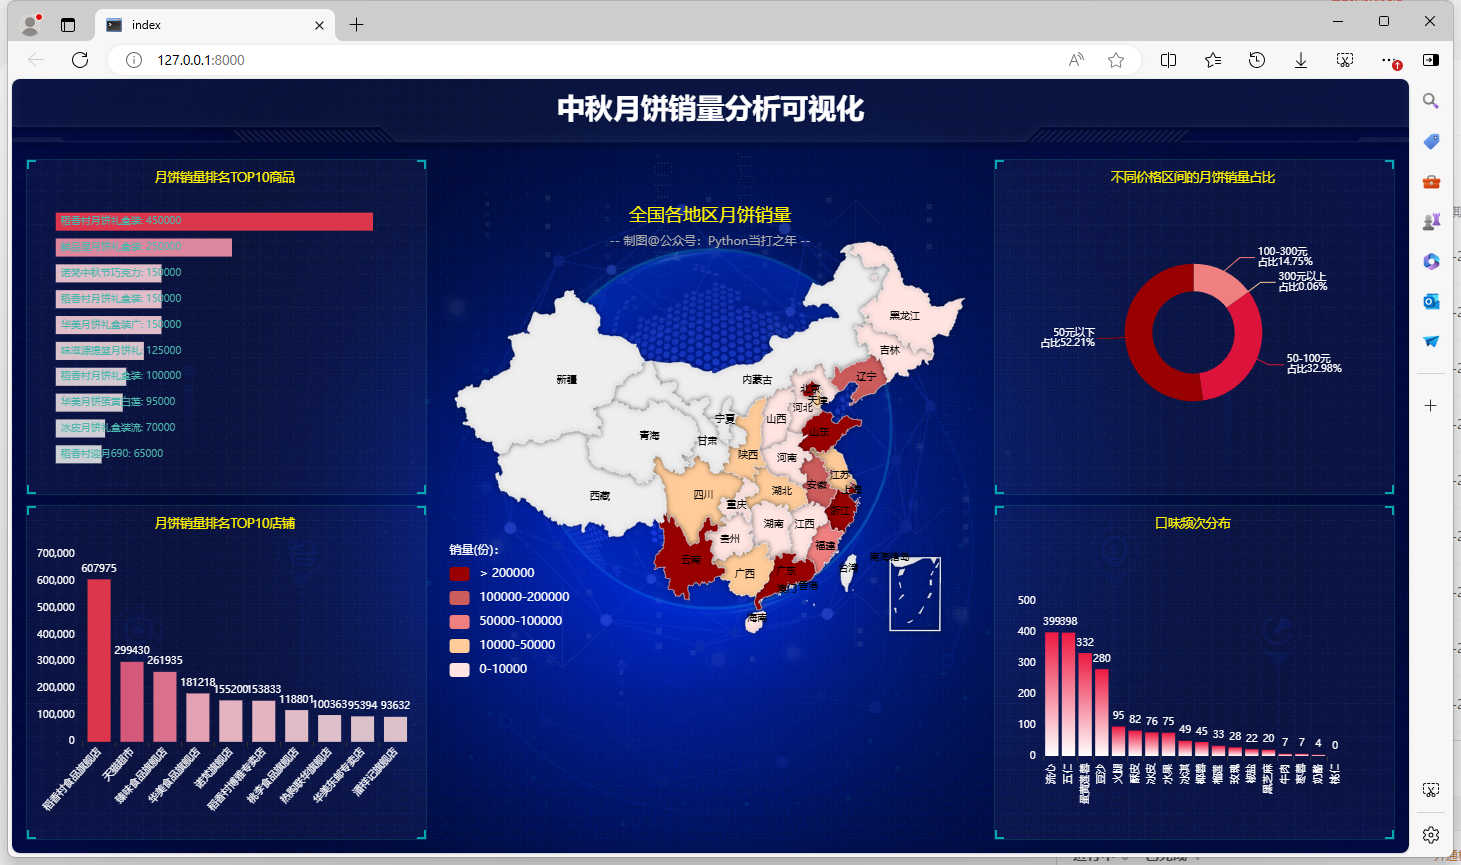
稻香村的月饼销量遥遥领先。
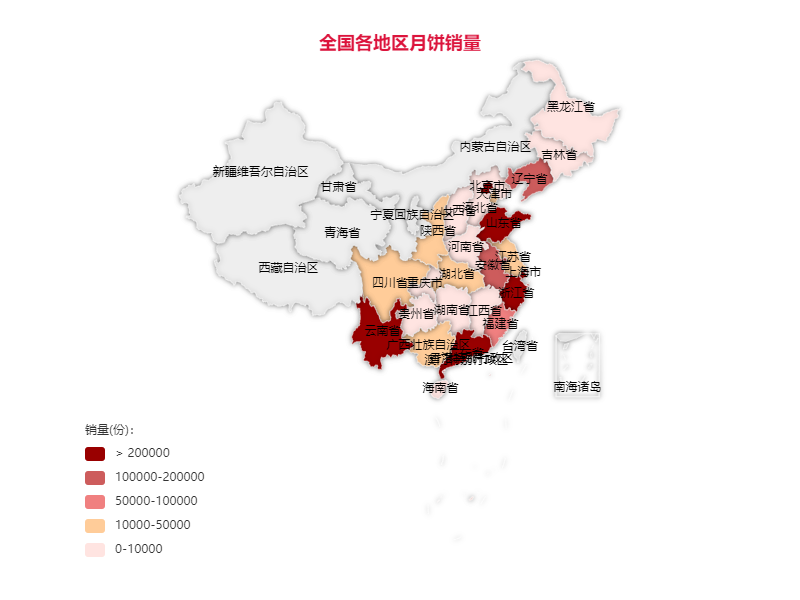
3.3 全国各地区月饼销量
province_num = df.groupby('省份')['销量'].sum().sort_values(ascending=False)
map_chart = Map(init_opts=opts.InitOpts(theme='light',
                                        width='800px',
                                        height='600px'))
map_chart.add('',
              [list(z) for z in zip(province_num.index.tolist(), province_num.values.tolist())],
              maptype='china',
              is_map_symbol_show=False,
              itemstyle_opts={
                  'normal': {
                      'shadowColor': 'rgba(0, 0, 0, .5)', # 阴影颜色
                      'shadowBlur': 5, # 阴影大小
                      'shadowOffsetY': 0, # Y轴方向阴影偏移
                      'shadowOffsetX': 0, # x轴方向阴影偏移
                      'borderColor': '#fff'
                  }
              }
              )
map_chart.set_global_opts(
    visualmap_opts=opts.VisualMapOpts(
        is_show=True,
        is_piecewise=True,
        min_ = 0,
        max_ = 1,
        split_number = 5,
        series_index=0,
        pos_top='70%',
        pos_left='10%',
        range_text=['销量(份):', ''],
        pieces=[
            {'max':2000000, 'min':200000, 'label':'> 200000', 'color': '#990000'},
            {'max':200000, 'min':100000, 'label':'100000-200000', 'color': '#CD5C5C'},
            {'max':100000, 'min':50000, 'label':'50000-100000', 'color': '#F08080'},
            {'max':50000, 'min':10000, 'label':'10000-50000', 'color': '#FFCC99'},
            {'max':10000, 'min':0, 'label':'0-10000', 'color': '#FFE4E1'},
           ],
    ),
    legend_opts=opts.LegendOpts(is_show=False),
    tooltip_opts=opts.TooltipOpts(
        is_show=True,
        trigger='item',
        formatter='{b}:{c}'
    ),
    title_opts=dict(
        text='全国各地区月饼销量',
        left='center',
        top='5%',
        textStyle=dict(
            color='#DC143C'))
)
map_chart.render_notebook()
结果:
3.4 不同价格区间的月饼销量占比
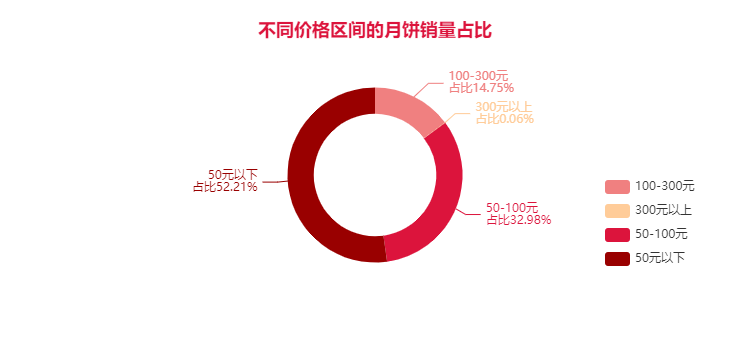
图片说明文字
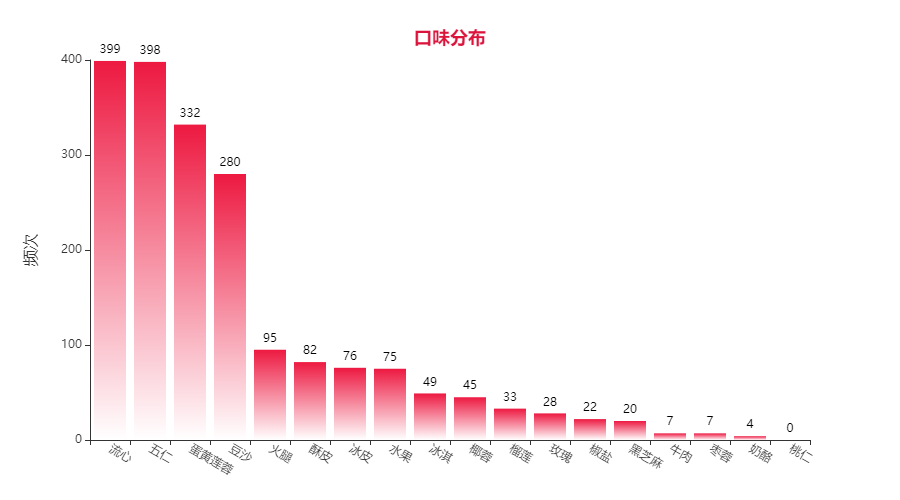
3.5 月饼口味分布
3.6 词云图

4. 普通大屏
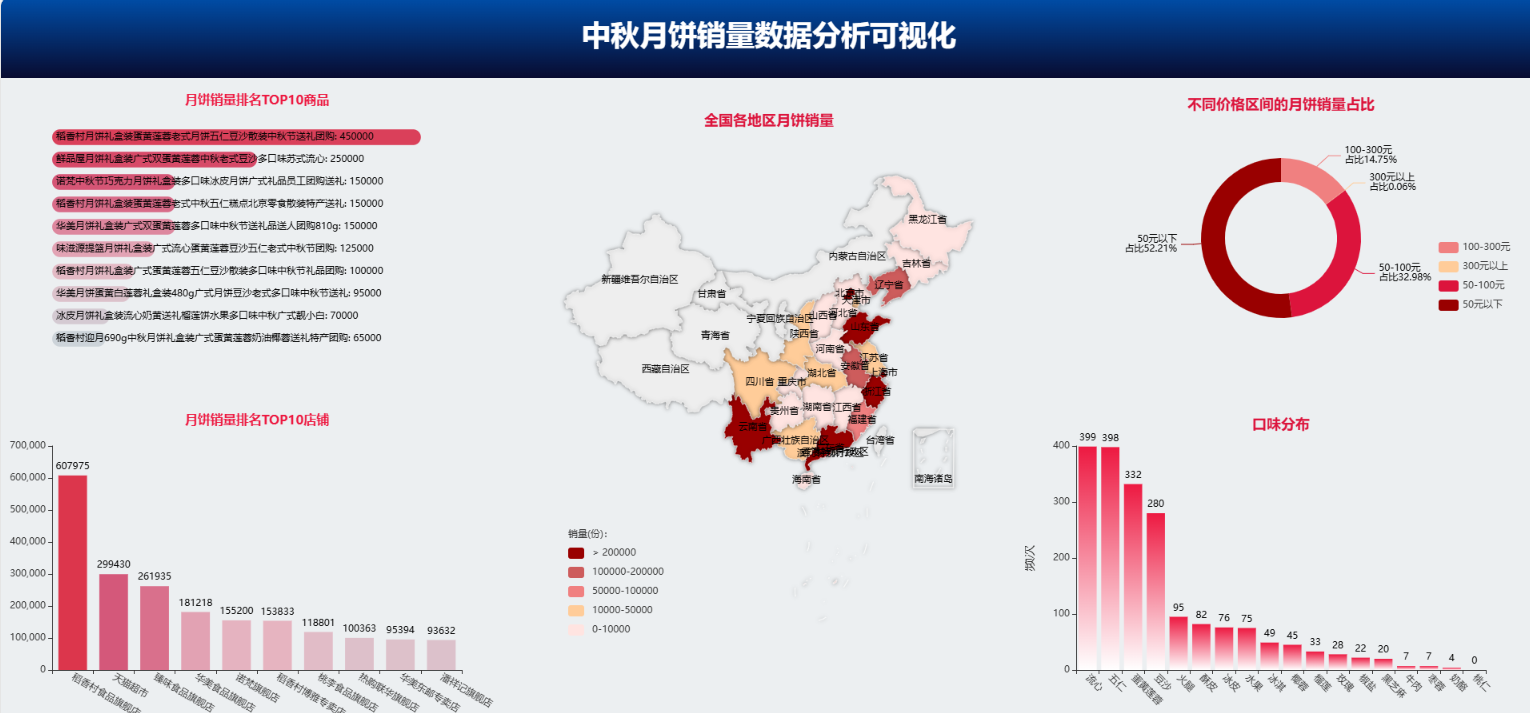
字
5. flask大屏
字