04 Pandas+Pyecharts | 2020东京奥运会奖牌数据可视化
- 可视化系列
- 2025-07-14
- 1293热度
- 1评论
大家好,我是欧K~
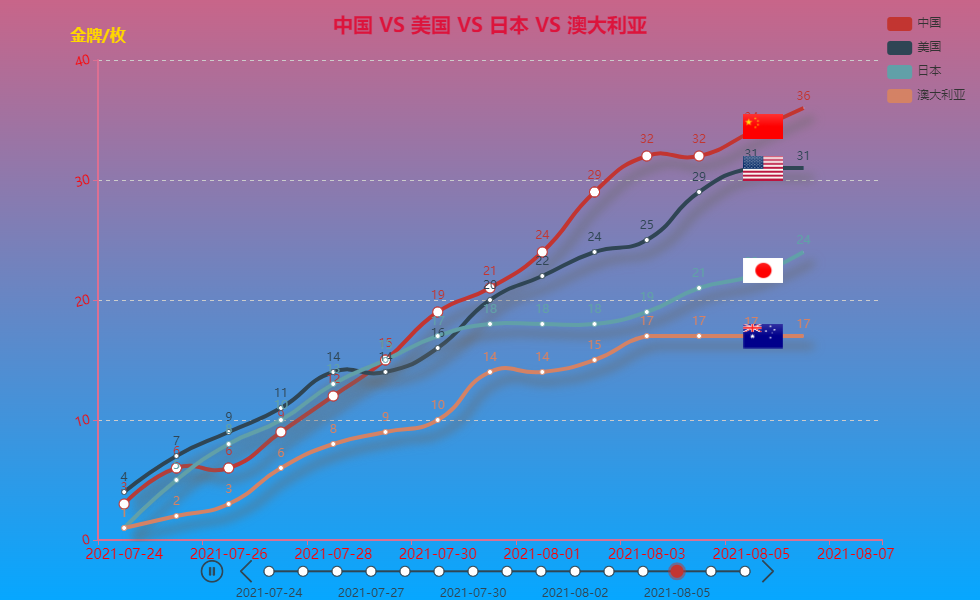
截至北京时间2024年7月30日6时,中国代表团在巴黎奥运会上获5金5银2铜,共计12枚奖牌,位列奖牌榜第3。
本期给大家动态展示上一届2020年东京奥运会各国的奖牌数据情况,希望对你有所帮助,如有疑问或者需要改进的地方可以联系小编。
先看看效果:
接下来我们分三步制作这幅动态展示图:
1. 导入模块
import pandas as pd
from pyecharts.charts import Timeline, Line
from pyecharts import options as opts
from pyecharts.commons.utils import JsCode
from pyecharts.globals import ThemeType
可视化部分需要用到 pyecharts==1.9.0,已安装其他低版本的需要升级
2. Pandas数据处理
2.1 读取数据
df = pd.read_csv('2020东京奥运会奖牌数据.csv', index_col=0, encoding = 'gb18030')
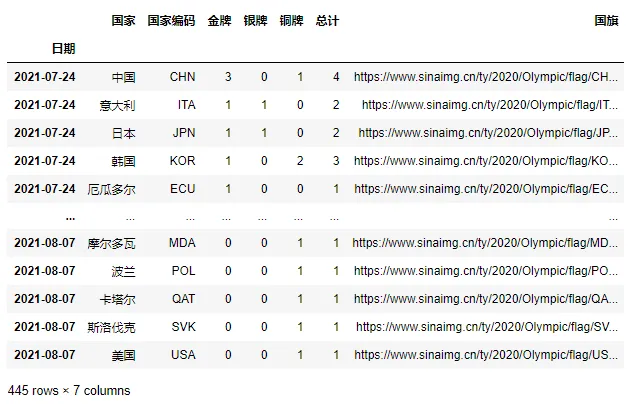
数据截止到7日,一共445条数据。
2.2 查看中国每日数据
df1 = df[df['国家']=='中国']
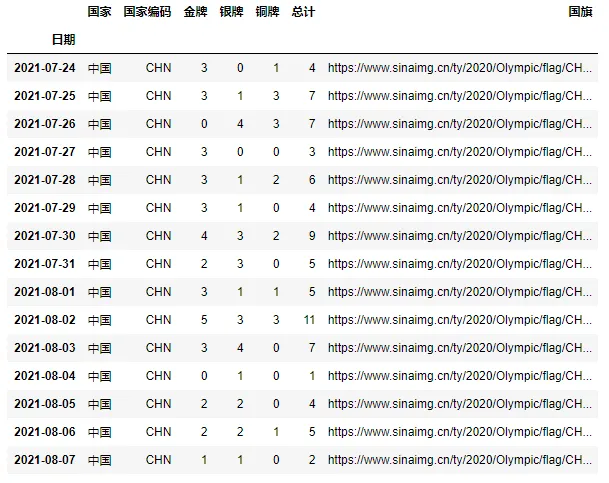
以上是每日获得奖牌(金牌、银牌、铜牌)数量。
2.3 统计中国、美国、日本、澳大利亚等国家奖牌数据
all_country_data = []
flg = {}
cols = ['国家']
for country in countrys:
    df1 = df[df['国家']==country]
    df_t = df1.copy()
    df2 = df.loc[df['国家']==country,['金牌','银牌','铜牌','总计']]
    if len(df2.index.tolist()) >= len(cols):
        cols += df2.index.tolist()
    one_country_data = [country]
    datasss = []
    for i in range(df2.shape[0]):
        datasss.append(df2[:i+1].apply(lambda x:x.sum()).values.tolist())
    d1 = pd.DataFrame(data=datasss, columns=['金牌','银牌','铜牌','总计'])
    df_t1 = df_t.loc[:,['金牌']]
    one_country_data += df_t['金牌'].values.tolist()
    all_country_data.append(one_country_data)
d2 = pd.DataFrame(data=all_country_data,columns=cols)
d2 = d2.fillna(method = 'ffill',axis=1)
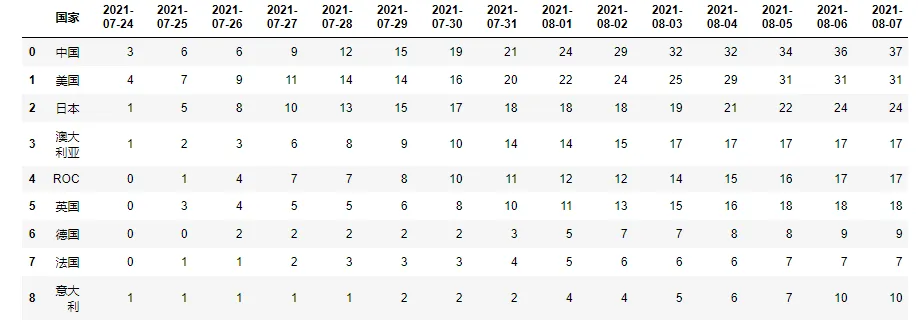
这样绘图所需要的数据就准备好了。
3. Pyecharts绘图
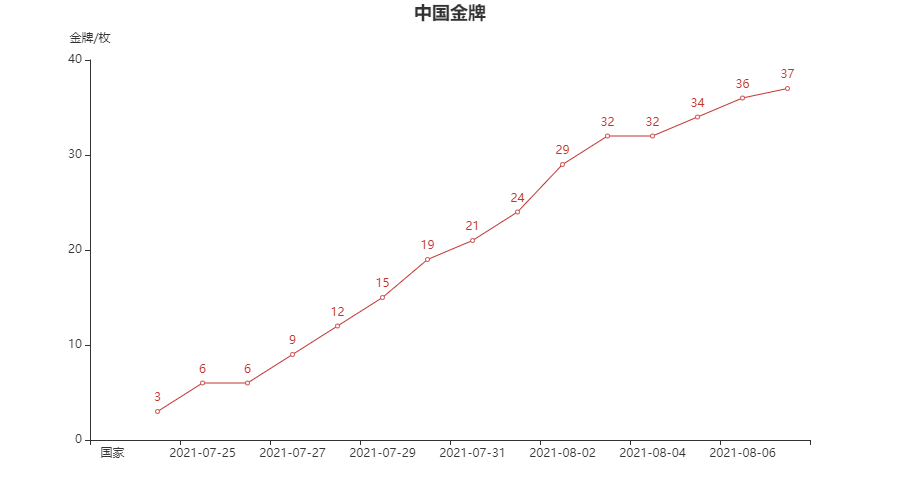
3.1 基础折线图
line = (
    Line()
    .add_xaxis(x_data)
    .add_yaxis(
        '中国',
        CHN,
        label_opts=opts.LabelOpts(is_show=True))
    .set_global_opts(
        title_opts=opts.TitleOpts(
            title='中国金牌',
            pos_left='center',
        ),
        yaxis_opts=opts.AxisOpts(
            name='金牌/枚',
            is_scale=True,
            max_=40),
        legend_opts=opts.LegendOpts(is_show=False),
    ))
line.render_notebook()
3.2 加载样式
timeline = Timeline(init_opts=opts.InitOpts(bg_color=JsCode(background_color_js),
line = (
    Line(init_opts=opts.InitOpts(bg_color=JsCode(background_color_js),
                                 width='980px',height='600px'))
    .add_xaxis(x_data)
    # 中国线条
    .add_yaxis(
        '中国',
        CHN,
        symbol_size=10,
        is_smooth=True,
        label_opts=opts.LabelOpts(is_show=True),
        markpoint_opts=opts.MarkPointOpts(
                data=[ opts.MarkPointItem(
                        name="",
                        type_='max',
                        value_index=0,
                        symbol='image://'+ flg['中国'],
                        symbol_size=[40, 25],
                    )],
                label_opts=opts.LabelOpts(is_show=False),
            )
    )
    .set_global_opts(
        title_opts=opts.TitleOpts(
            title='中国金牌',
            pos_left='center',
            pos_top='2%',
            title_textstyle_opts=opts.TextStyleOpts(
                    color='#DC143C', font_size=20)
        ),
        xaxis_opts=opts.AxisOpts(axislabel_opts=opts.LabelOpts(font_size=14, color='red'),
                                 axisline_opts=opts.AxisLineOpts(is_show=True,
                                    linestyle_opts=opts.LineStyleOpts(width=2, color='#DB7093'))),
        yaxis_opts=opts.AxisOpts(
            name='金牌/枚',
            is_scale=True,
            max_=40,
        ),
        legend_opts=opts.LegendOpts(is_show=False, pos_right='1.5%', pos_top='2%',
                                    legend_icon='roundRect',orient = 'horizontal'),
    ))
line.render_notebook()
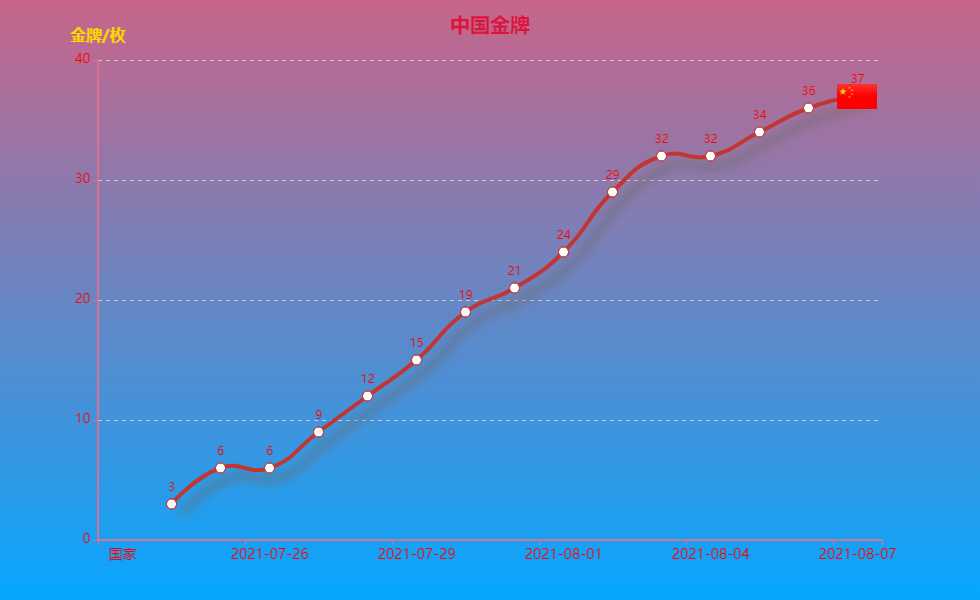
3.3 动态展示中国每日金牌数据
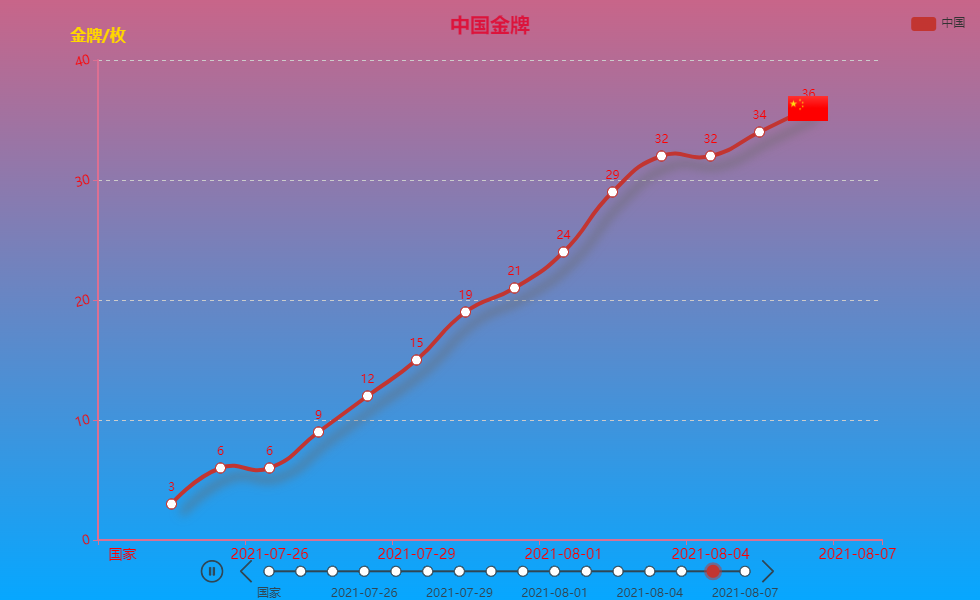
3.4 添加其他国家数据