Matplotlib | 手把手教你绘制官网神图
- 教程系列
- 2025-07-30
- 1521热度
- 0评论
大家好,我是欧K~
本期给大家介绍一下matplotlib官网示例图(https://matplotlib.org),希望对大家有所帮助,如有疑问或者需要改进的地方可以联系小编。
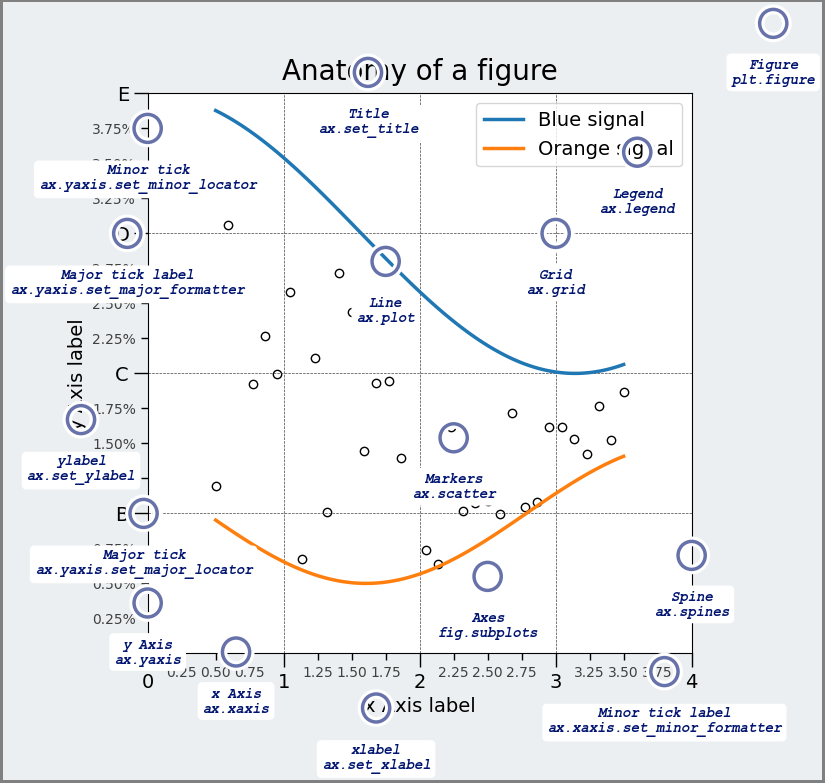
示例图(部分调整):
1. 导入模块
import numpy as np
import matplotlib.pyplot as plt
from matplotlib.patches import Circle
from matplotlib.patheffects import withStroke
from matplotlib.ticker import AutoMinorLocator, MultipleLocator
2. 绘图
2.1 绘制图布,设置极坐标系
# 绘图
fig = plt.figure(figsize=(8,8),facecolor='#ECEFF1')
ax = fig.add_axes([0.2, 0.17, 0.68, 0.7])
# 设置x、y轴范围
ax.set_xlim(0, 4)
ax.set_ylim(0, 4)
2.2 设置主、次刻度
# 设置坐标轴主刻度
ax.xaxis.set_major_locator(MultipleLocator(1))
ax.yaxis.set_major_locator(MultipleLocator(1))

# 设置坐标轴次刻度
ax.xaxis.set_minor_locator(AutoMinorLocator(4))
ax.yaxis.set_minor_locator(AutoMinorLocator(4))
2.3 设置次刻度文本格式
# 设置坐标轴次刻度文本格式
ax.xaxis.set_minor_formatter("{x:.2f}")
ax.yaxis.set_minor_formatter("{x:.2f}%")
2.4 坐标轴标签替换、修改刻度线
# 坐标轴标签替换
ax.set_yticks(np.linspace(0, 4, 5))
ax.set_yticklabels(list('ABCDE'))

# 设置刻度线样式
ax.tick_params(which='major', width=1, length=10, labelsize=14)
ax.tick_params(which='minor', width=1.0, length=5, labelsize=10, labelcolor='0.25')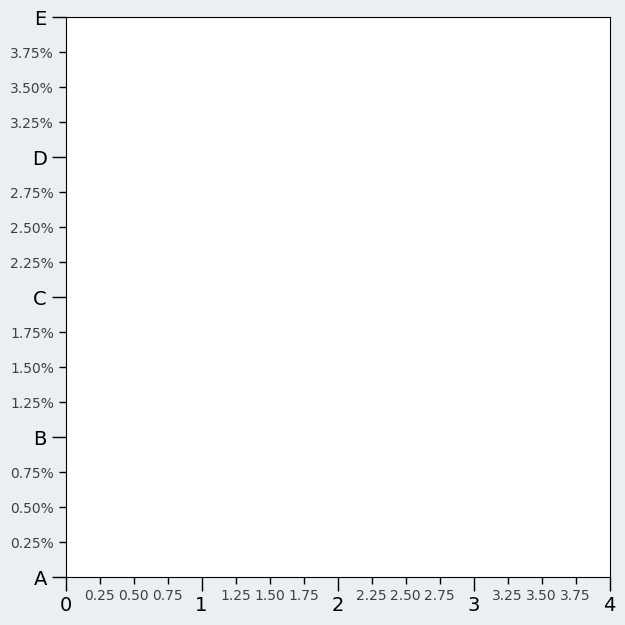
2.5 绘制曲线、栅格
# 数据
X = np.linspace(0.5, 3.5, 100)
Y1 = 3+np.cos(X)
Y2 = 1+np.cos(1+X/0.75)/2
Y3 = np.random.uniform(Y1, Y2, len(X))
ax.plot(X, Y1, c='C0', lw=2.5, label="Blue signal", zorder=10)
ax.plot(X, Y2, c='C1', lw=2.5, label="Orange signal")

# 设置栅格
ax.grid(linestyle="--", linewidth=0.5, color='.25', zorder=-10)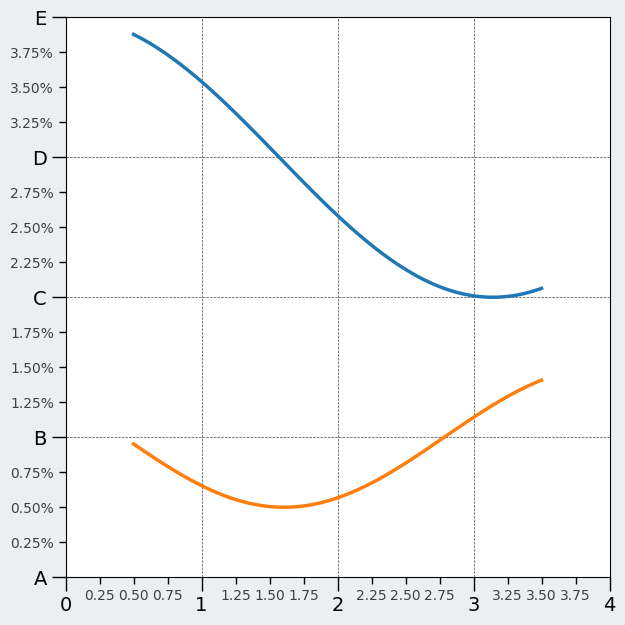
2.6 添加散点
ax.scatter(X[::3], Y3[::3],marker = 'o',color="w",edgecolors='black')2.7 设置标题、标签、图例
# 设置标题
ax.set_title("Anatomy of a figure", fontsize=20, verticalalignment='bottom')

# 设置标签
ax.set_xlabel("x Axis label", fontsize=14)
ax.set_ylabel("y Axis label", fontsize=14)

# 设置图例
ax.legend(loc="upper right", fontsize=14)
royal_blue = [0, 20/256, 112/256]
bbox=dict(boxstyle="round", fc="w", ec="w")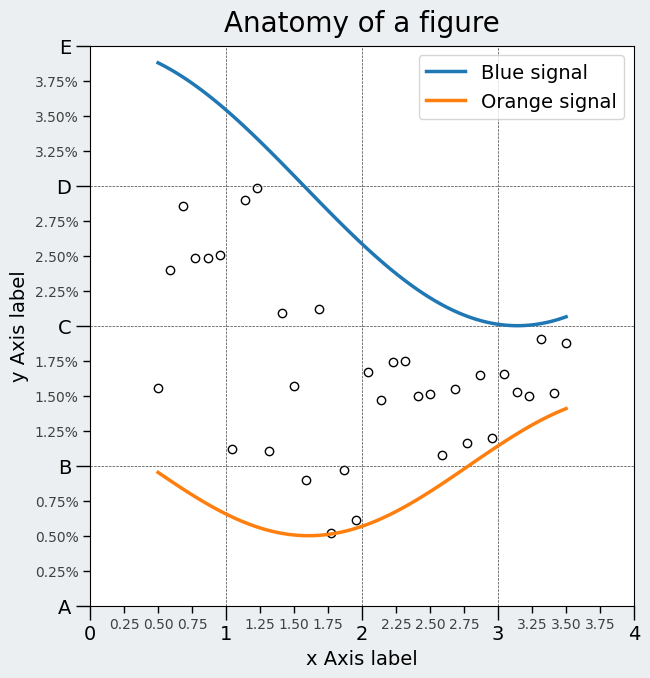
2.8 绘制标注
# 绘制标注
def annotate(x, y, text):
    c = Circle((x, y), radius=0.1, clip_on=False, zorder=10, linewidth=2.5,
               edgecolor=royal_blue + [0.6], facecolor='none',
               path_effects=[withStroke(linewidth=7, foreground='white')])
    ax.add_artist(c)
    ax.text(x, y-0.25, text, style='italic', fontfamily='Courier New', ha='center', va='top', weight='bold',color=royal_blue,bbox=bbox)

annotate(3.8, -0.13, "Minor tick label\nax.xaxis.set_minor_formatter")
annotate(-0.03, 1.0, "Major tick\nax.yaxis.set_major_locator")
annotate(0.00, 3.75, "Minor tick\nax.yaxis.set_minor_locator")
annotate(-0.15, 3.00, "Major tick label\nax.yaxis.set_major_formatter")
annotate(1.68, -0.39, "xlabel\nax.set_xlabel")
annotate(-0.49, 1.67, "ylabel\nax.set_ylabel")
annotate(1.62, 4.15, "Title\nax.set_title")
annotate(1.75, 2.80, "Line\nax.plot")
annotate(2.25, 1.54, "Markers\nax.scatter")
annotate(3.00, 3.00, "Grid\nax.grid")
annotate(3.60, 3.58, "Legend\nax.legend")
annotate(2.5, 0.55, "Axes\nfig.subplots")
annotate(4.6, 4.5, "Figure\nplt.figure")
annotate(0.65, 0.01, "x Axis\nax.xaxis")
annotate(0, 0.36, "y Axis\nax.yaxis")
annotate(4.0, 0.7, "Spine\nax.spines")
2.9 设置边框
# 设置边框
fig.patch.set(linewidth=4, edgecolor='0.5')
3. 源码
源码文件可在公众号后台回复【官网图】获取
代码实战-scaled.png)